
30 Nov Monthly Commentary: November 2020
Key global trends – equities drop further
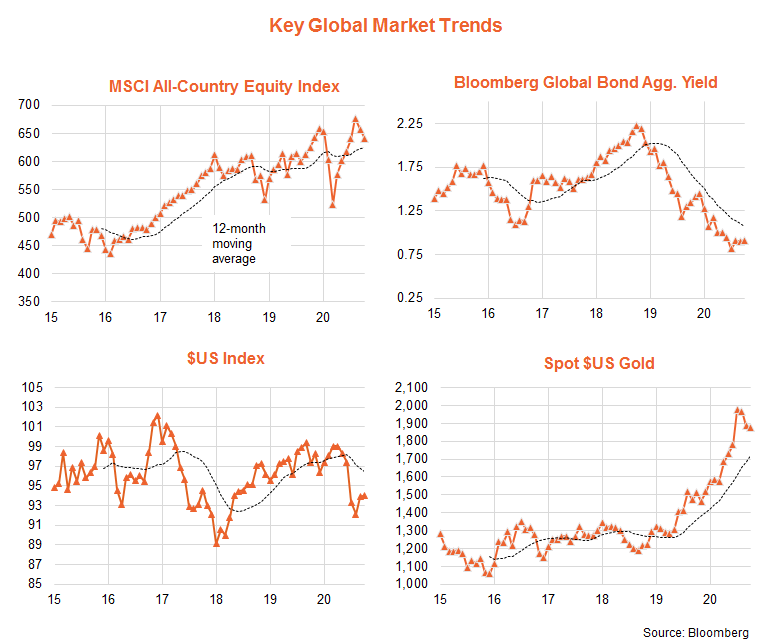
Global equities eased back for the second month in a row in October as rising COVID-19 cases in Europe and the United States, concern over the lack of new U.S. fiscal stimulus and Presidential election jitters took their toll. Although overall global bond yields – along with the $US and gold prices – remained relatively steady, U.S. 10-year bond yields had a notable lift from 0.68% to 0.87%.
As seen in the chart set below, global bond yields and the $US remain in a medium-term downtrend, with global equities and gold prices in an uptrend*. There are tentative signs, however, that global bond yields and the $US may have bottomed, and gold prices may have peaked. Further weakness in global equities could also suggest they are in fact still trapped in a broader sideways range evident since early 2018.
Global equity fundamentals – valuations reliant on low bond yields, earnings expectations have lifted
Fundamentally, the equity outlook remains encouraging – provided bond yields stay low and the recent stabilisation in earnings expectations persists.
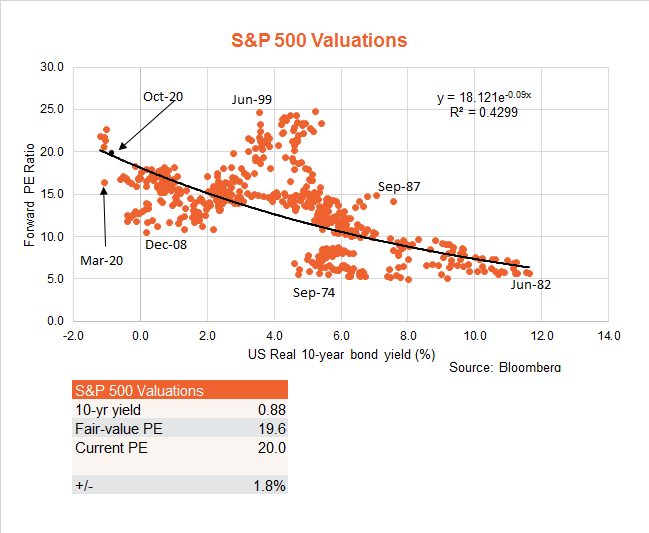
As seen in the first chart below, the S&P 500 ended October at a price-to-forward earnings (PE) ratio of 20.0 – which is a bit lower than the levels seen in recent months, due to both the correction in prices and a modest lift in forward earnings. While the PE ratio remains above its long-run average level, valuations are more reasonable given the continued very low level of bond yields.
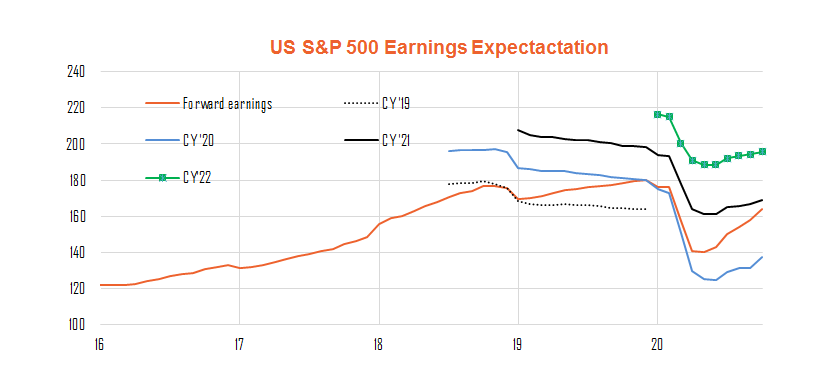
As evident in the chart below, moreover, U.S. earnings expectations continued to hold up over October – with the latest quarterly earnings reporting season tending to surprise on the upside. Based on current market expectations, U.S. forward earnings are on track to rise by 19% between now and end-2021.
Note: ‘forward earnings’ is a weighted average of current and subsequent calendar year estimates – with the weight on next year’s earnings rising as it gets closer. In essence, for example, forward earnings in June 2020 reflect a weight of 50% to CY’20 and CY’21 earnings respectively. In December this year, forward earnings will place a 100% weight on CY’21 earnings (wherever analyst expectations are at the time).
Key global equity themes – U.S., technology, growth and quality
By region, the U.S. and emerging markets retain the strongest performance trends, with the strongest sectors being technology and consumer discretionary and the strongest factors momentum, growth and quality. In October, however, many of these leading themes suffered stronger pullbacks, with the exception of emerging markets. Europe also performed especially poorly, likely reflecting rising COVID-19 concerns, as did energy stocks given a further slump in oil prices. Australia enjoyed a rare month of outperformance, with the S&P/ASX 200 returning 1.9%.
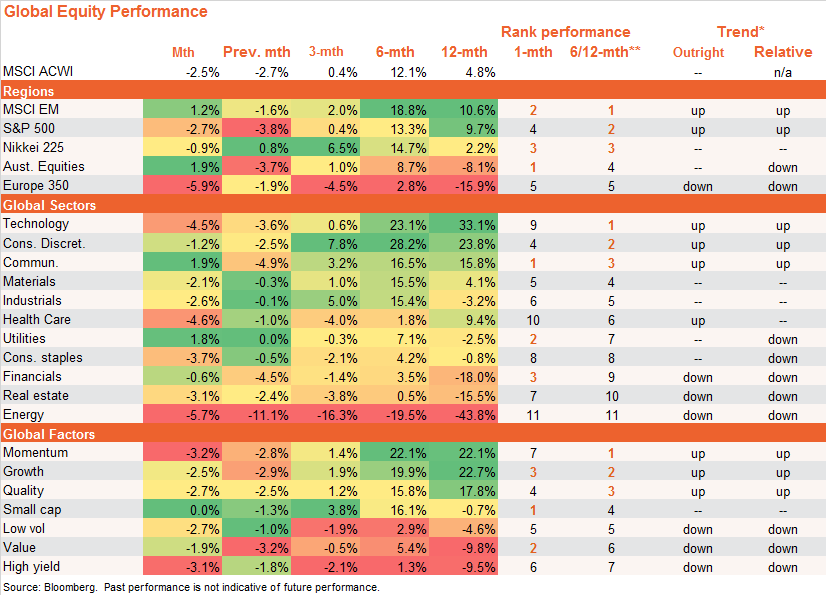
Tables ordered by 6/12 month return performance for each region, sector and factor respectively – on a local currency basis. Past performance is not indicative of future performance. You cannot invest directly in an index.
Within Australian equities, technology and small caps retain the strongest performance trends and delivered further solid gains in October – along with financials and the fundamentally weighted equity index. Resources have tended to underperform in recent months in line with a pull back in iron-ore prices.
The tech heavy NASDAQ-100, gold miners and global quality retain the strongest performance trends, though it was the beleaguered financial sector which held up best in October. Energy producers and health care had notable declines.
Better returns were again evident among unhedged global equity funds, reflecting weakness in the $A. Asian technology, robotics and artificial intelligence and emerging markets enjoyed solid gains in the month and have the strongest relative performance trends.
Cash and bonds – government yields drop, credit spreads widen
Falling bond yields and contained credit spreads continue to generally favour duration and credit exposures in the local cash and fixed income market. The Reserve Bank’s decision to cut the official cash rate and 3-year bond yield targets to 0.1% – and launch a $100 billion government bond buying program – at the November policy meeting should continue to support these trends.
What’s more, the RBA has indicated it currently does not anticipate raising short-term interest rates for around three years, and stands ready to buy even more government bonds to hold down longer term yields if the economy needs further support.
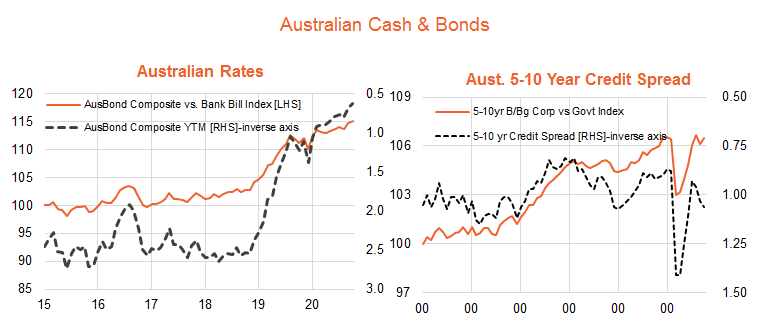
As would be expected in this environment, long-duration corporate bond fund and long-duration government bond fund have tended to outperform the Australian fixed-income benchmark in recent months. Still-contained credit spreads also continued to support the performance of hybrids and floating-rate bonds over cash.
*Trend: Outright trend is up if the relevant NAV return index is above its 12-month moving average and the slope of the moving average is positive, and down if the index is below this moving average and the slope of the moving average is negative. No trend is displayed in all other cases. Relative trend is based on the ratio of the relevant return index to its broader Australian or global benchmark index.
**The ranking of performance is based on an equally-weighted average of 6 & 12 month return performance.
This article was originally produced by David Bassanese from BetaShares you can read the full article here.
Next Steps
To find out more about this program and whether you might be eligible, speak to us to get you moving in the right direction.
Important information and disclaimer
The information provided in this document is general information only and does not constitute personal advice. It has been prepared without taking into account any of your individual objectives, financial solutions or needs. Before acting on this information you should consider its appropriateness, having regard to your own objectives, financial situation and needs. You should read the relevant Product Disclosure Statements and seek personal advice from a qualified financial adviser. From time to time we may send you informative updates and details of the range of services we can provide.
FinPeak Advisers ABN 20 412 206 738 is a Corporate Authorised Representative No. 1249766 of Aura Wealth Pty Ltd ABN 34 122 486 935 AFSL No. 458254 (a subsidiary of Spark FG ABN 15 621 553 786)
No Comments